Auburn Real Estate, First Quarter Comparisons, 2011 to 2012
Auburn Real Estate, First Quarter Comparisons, 2011 to 2012
Here is the analysis of Auburn, California real estate comparing the first quarter of 2011 with the first quarter of 2012. For this study I have used only residential homes (one or two dwellings per parcel) and excluded raw land, commercial property, condominiums, and multi-units (duplexes, apartments, etc.). I selected Auburn, Southwest of Auburn, Meadow Vista, and Christian Valley as the geographic areas for the comparison. I excluded the non-incorporated areas of Auburn that are north of the Bear River in Nevada County, thereby eliminating “South County” and Lake of the Pines. The data was obtained from the Metrolist Multiple Listing Service.
FIRST QUARTER 2011
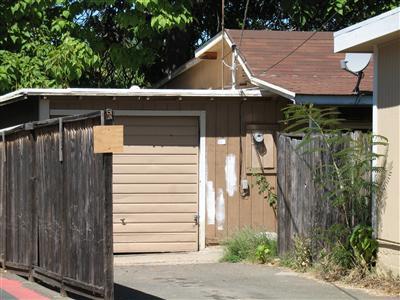
Here is the lowest priced house sold in the first quarter of 2011.
This property near downtown Auburn on Electric Street was listed for $79,900 and sold for $69,900 after being on the market for 85 days. It s0ld for 87% of the asking price. At 665 square feet it sold for $105 per square foot.
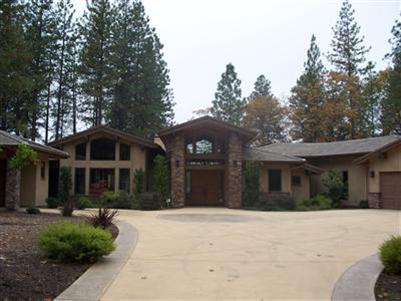
Here is the highest priced house sold in the first quarter of 2011.
For the past couple of years, the priciest homes in the Auburn area have been located in the Winchester Country Club near Meadow Vista. This home was put on the market at $1,387,500 then reduced to $1,245,000 and sold for $1,165,000. It was on the market for 59 days and sold for 94% of the listing price. At 4142 square feet it sold for $281 per square foot.
FIRST QUARTER 2012
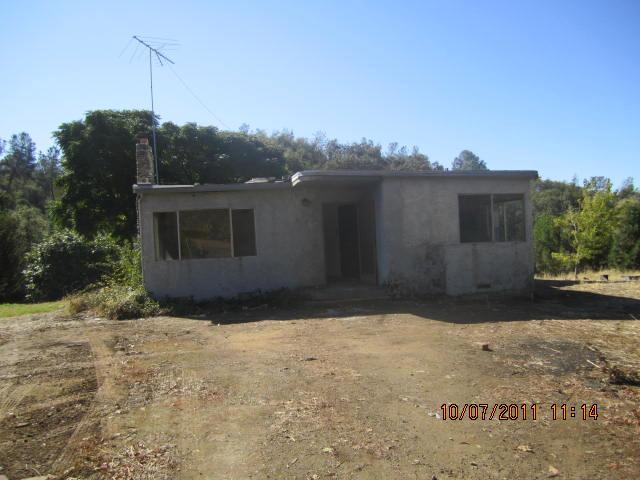
Here is the lowest priced house sold in the first quarter of 2012.
This property out on Mount Vernon Road was listed for $59,900 and sold for $65,000 after being on the market for 25 days. It s0ld for $5,100 above asking price. At 1104 square feet it sold for $59 per square foot.
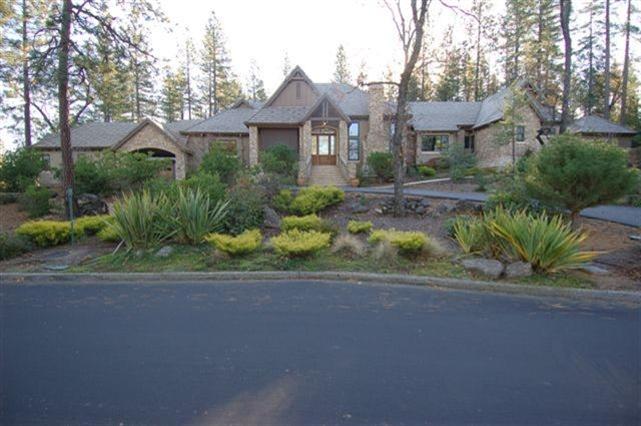
Here is the highest priced home sold in the first quarter of 2012.
As in the previous year, the priciest home in the Auburn area was located in the Winchester Country Club near Meadow Vista. This home was put on the market at $899,900 and sold in 3 days for $900,000, a whopping $100 above asking price. At 5288 square feet it sold for $170 per square foot
YEAR-TO-YEAR COMPARISONS FOR THE FIRST QUARTER
2011 number of houses sold 123
2012 number of houses sold 137
2011 average days on market 121
2012 average days on market 82
2011 average price per quare foot $143
2012 average price per quare foot $144
2011 %selling price/listing price 96.49%
2012 %selling price/listing price 97.18%
2011 average original price $340,326
2012 average original price $320,755
2011 average listing price $309,455
2012 average listing price $3o6,871
2011 average sale price $298,610
2012 average sale price $298,212
2011 median sale price $259,500
2012 median sale price $263,000
ANALYSIS
Houses sold a bit quicker in 2012 than in 2011, and a few more houses sold first quarter of this year than in 2011, but the cost of home buying was virtually unchanged. You would have trouble finding a “flatter” market. Inventory remains low, and lower-end houses priced at market value are snapped up quickly by first-time homebuyers and investors. Interest rates have fallen even lower which makes houses more affordable, but lending requirements have tightened, knocking some marginally qualified buyers out of the market.
If you enjoyed reading this article, and want to find out more,
just CALL CJ at (530-906-4715) or subscribe below.
Stay Informed
Get the latest posts delivered direct to your email
